How did Apple cut launch time by 30% in iOS 27?

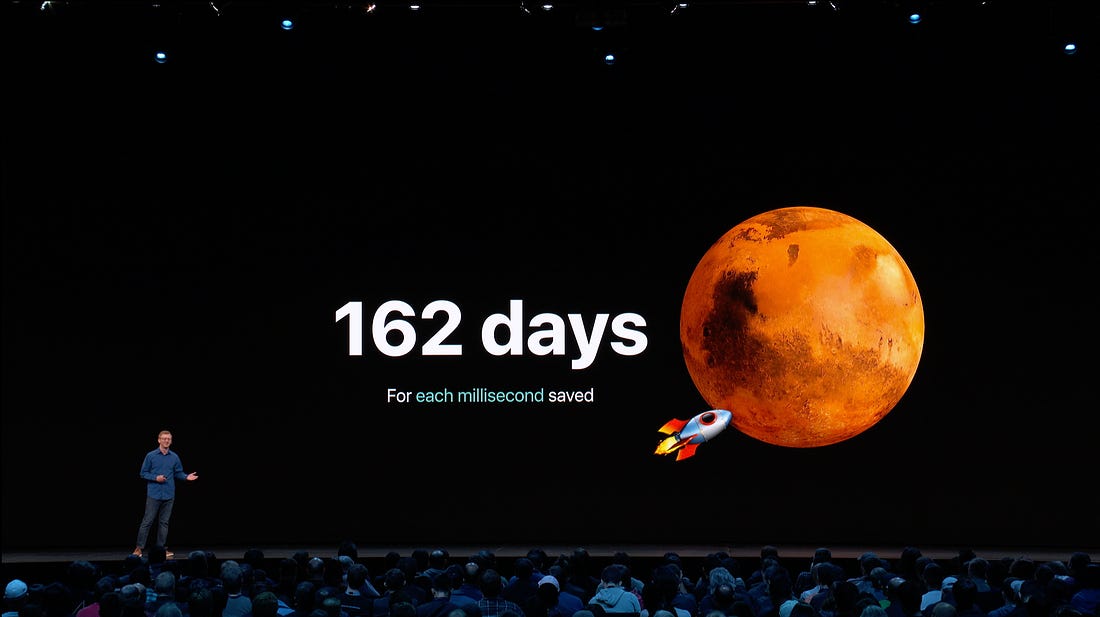
Launch time is the most impactful metric you never optimise. Say you’re WhatsApp. You have a kajillion daily active users, except in America for some reason. They may be warm-launching your app 10x a day. More. A launch speed of 0.5 seconds, times 10, times a kajillion, means even a 1% improvement probably saves a few lifetimes’ worth. I haven’t checked my maths, and I’m not going to. Apple, helpfully, checked theirs. At WWDC19’s Optimizing App Launch session, they computed across billions of daily launches: shaving just 1ms off launch saves just about enough time each day to send a rocket to Mars.
Apple had a “Snow Leopard” year this WWDC. Less flashy features, less UI overhauls nobody asked for, more cold platform optimisations. They claimed to have added a 30% boost to app launch times in iOS 27. I’ve chatted to you before about optimising launch time on a legacy app, and tracing launch performance in production. What I haven’t done is go all the way down. So today that’s what we’ll do:
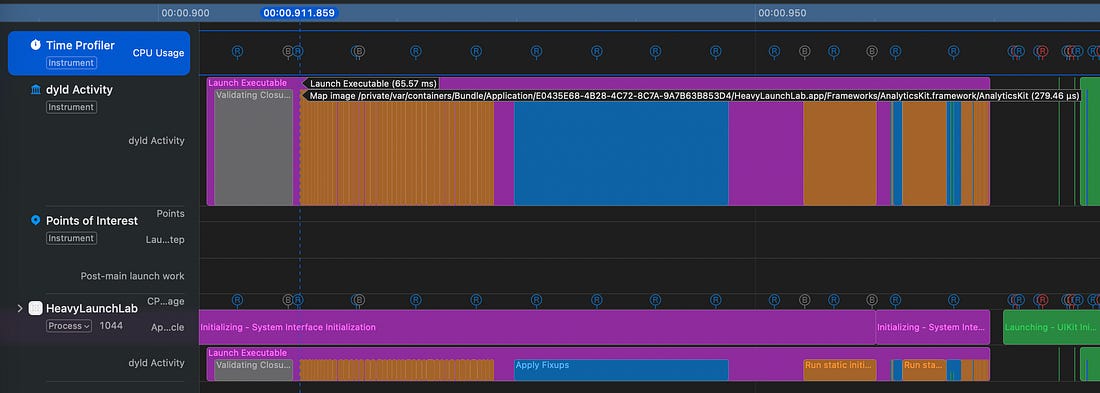
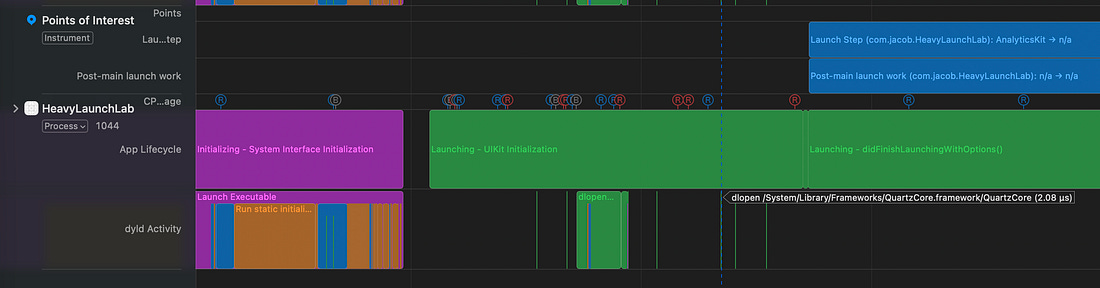
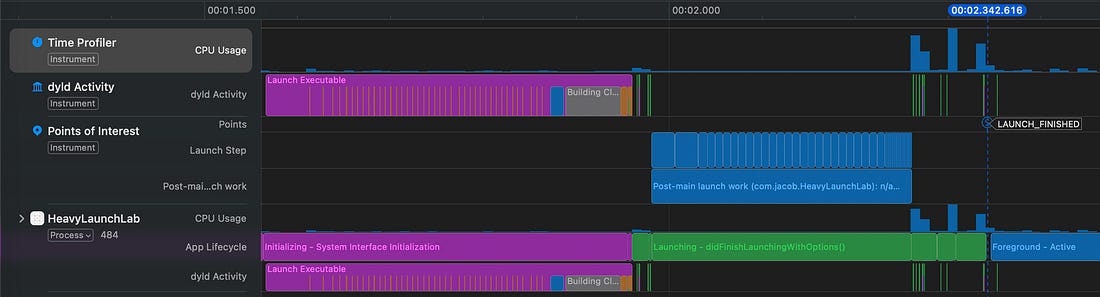
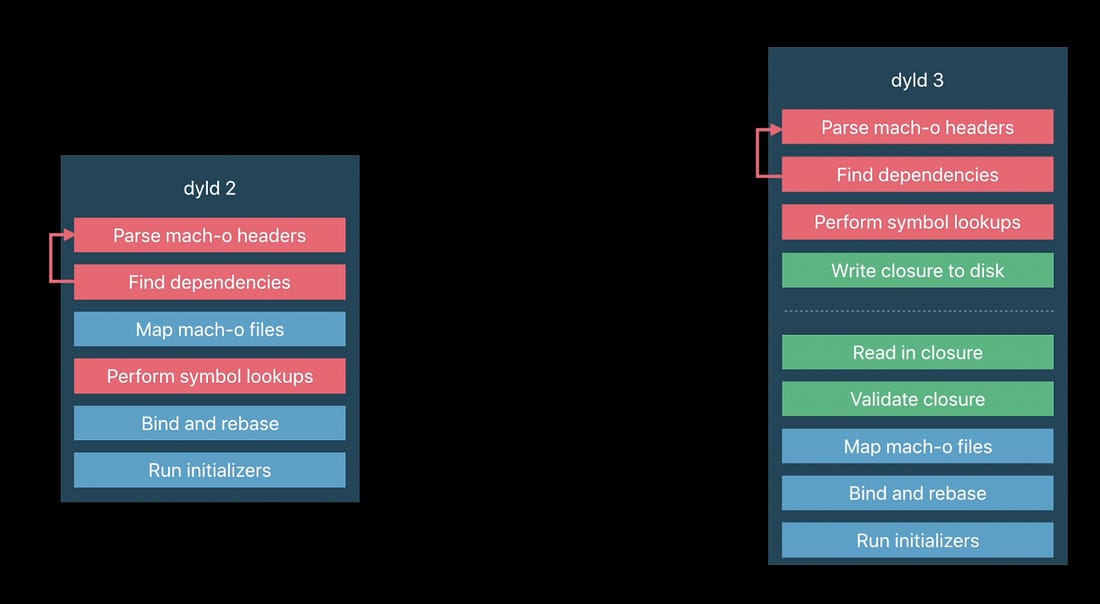
This article is so packed with knowledge, your email client will cut it off. Click here to read on my website. Launch TheoryFlavours of LaunchThere are three kinds of launch: 🐢 A cold launch is what you think of as a “launch”. The app process doesn’t exist, your binary is sitting in storage. WWDC2016 explains that cold launches mostly only happen the first launch after install or restart. This is your first impression, though, so you probably want to worry about this. 🐇 A warm launch spawns a fresh process, but iOS caches binary memory pages aggressively in the kernel file cache, and dyld still holds onto a precomputed launch plan. tl;dr: the data is closer to where it needs to be. 🐅 There is no “hot launch”. It’s just a resume, foregrounding a backgrounded or suspended app that is already alive in process memory. Launch PhasesThere are 2 phases of launch to understand, based on when the main() function is called in your app process. Knowing about pre-main launch steps is a great way to get ahead when your job interviewer is a jerk. First the kernel maps your Mach-O executable into process memory. Dyld, the dynamic linker, loads up the dynamic frameworks needed by your app, including your own code, third-party dependencies, and system frameworks like Foundation, UIKit, and Swift. Address Space Layout Randomisation (ASLR) is a critical protection against memory corruption exploits, randomising the memory address of many of these frameworks in process memory at launch. Therefore dyld applies “fixups” to write symbol references to real memory addresses. The Swift runtime sets up type metadata, protocol conformances, and generics. Finally, some of your own code might run: static initialisers and Objective-C load() methods. This is a ton of work, but we will shortly see it visible in our instruments traces. Nobody’s giving you a job for knowing about post-main. If you’re into CLIs, or hardcore (like me), you might have your own explicit main() method. UIApplicationMain creates the app object, sets up the run loop, the app delegate, and ultimately calls application(_:willFinishLaunchingWithOptions:). You know the rest, and if you don’t, my blog has a lot of solid iOS content. Launch ends when your first frame renders. Optimising this side is standard engineering: profile, parallelise, and minimise the amount of work on the critical path before the user gets what they’re looking for. Reading the Launch TraceThe App Launch instrument gives a cool visual overview of the theory above.
Post-main, we can also see UIKit initialisation, didFinishLaunchingWithOptions, UIScene creation, then the declaration of victory: Foreground — Active*.
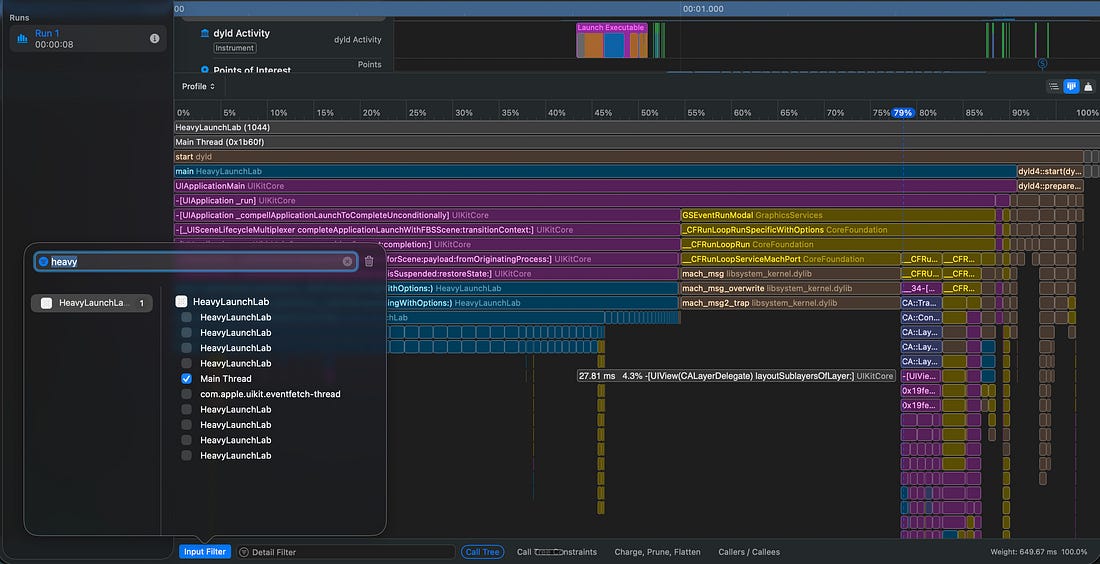
Xcode 27 adds a cool flamegraph. On the Time Profile, hit the little blue button in the top-right, filter by your process, filter to the main thread, and you’ll see something like this:
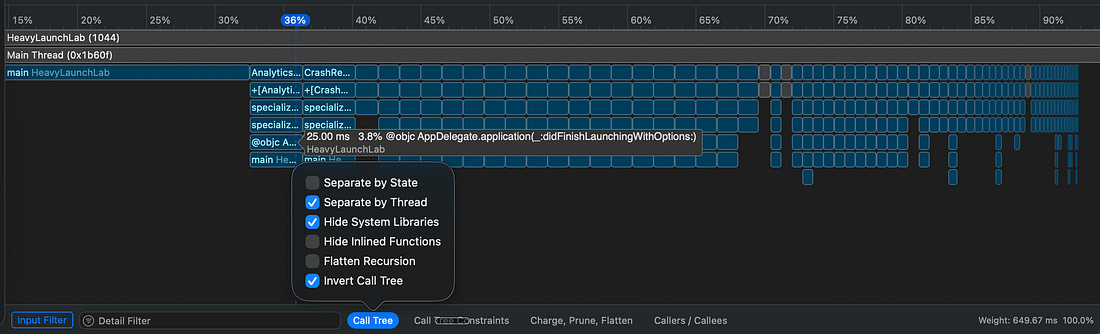
The % gives each segment’s share of CPU time in the given time window. To make things more useful for us, we can hide system libraries and see how our own code breaks down at launch*.
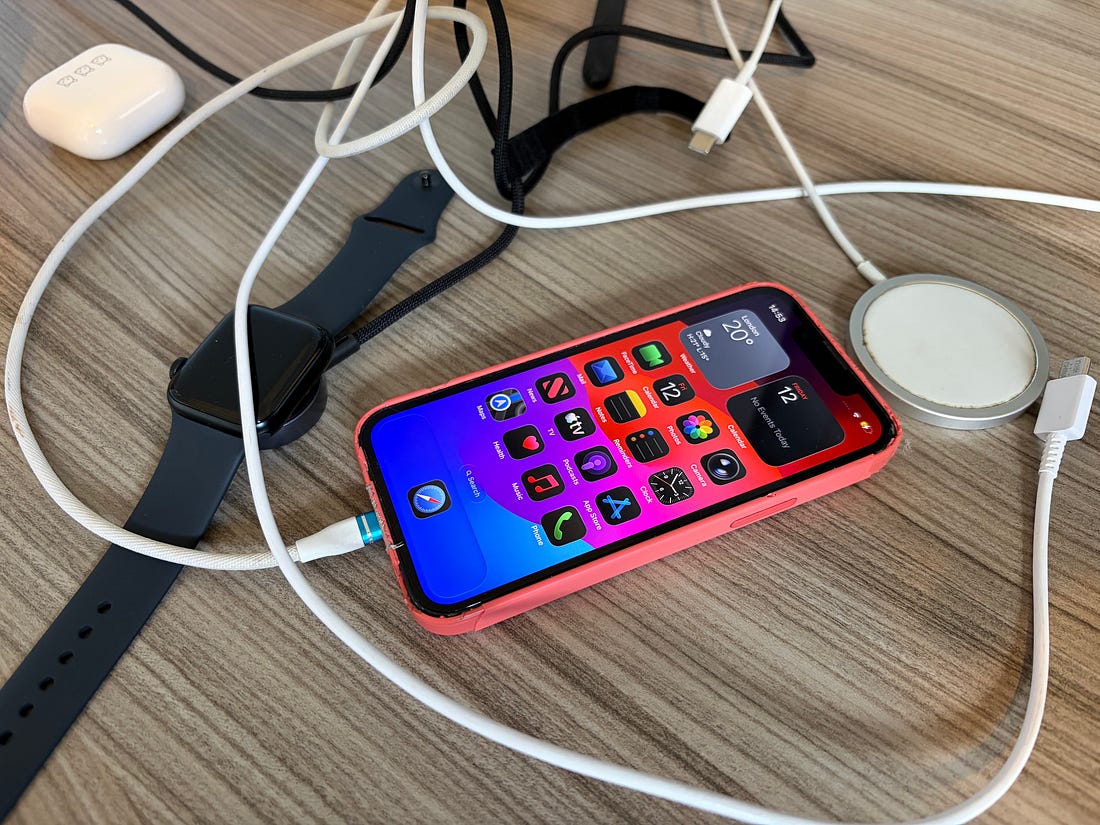
I’m not throwing away my shot 🎯I’m not Apple. I don’t have a bargain bin full of iPhone 11 Pro Maxes to profile with. I get one shot per year to run a proper before-and-after to profile OS upgrades. Since I don’t want the results to be too good, I whipped out my trusty iPhone 13 mini (from my cable drawer, which is inexplicably strewn across my desk).
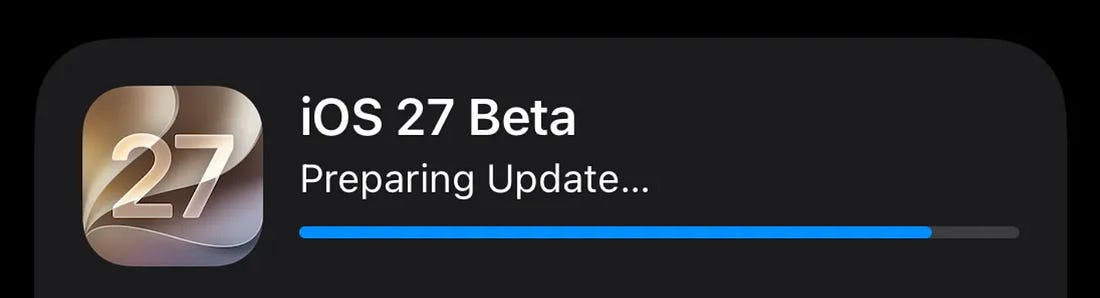
Fortunately, I realised this before the automatic beta update landed. Just.
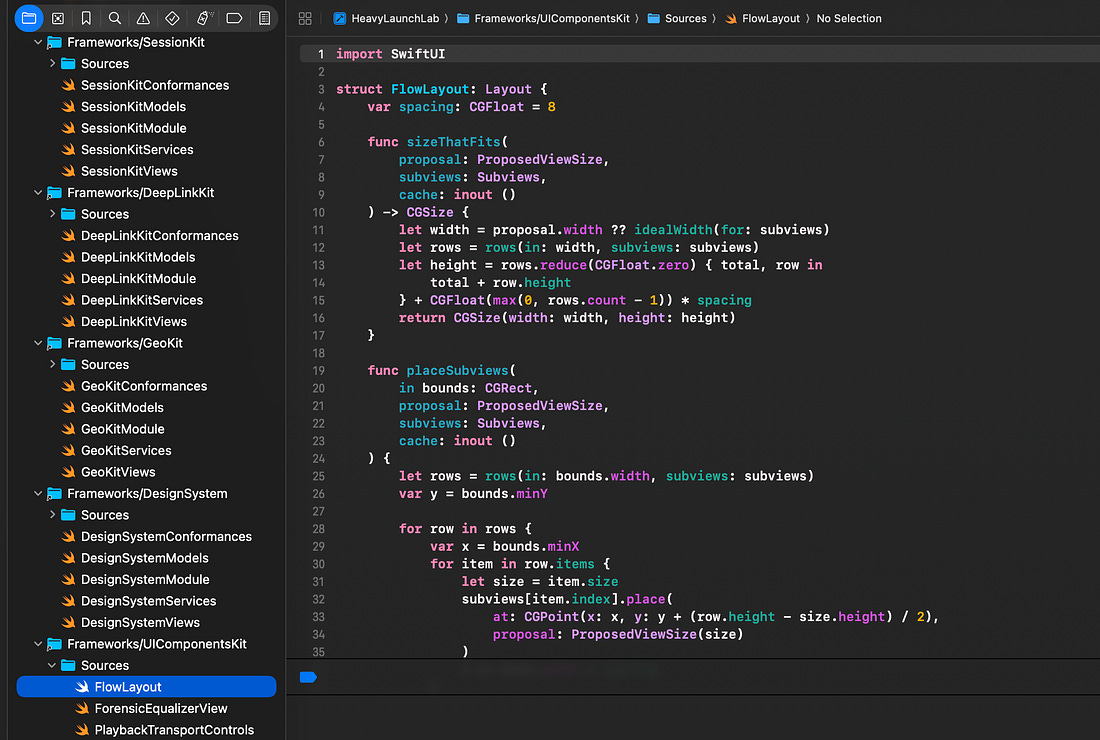
I vibe-coded a deliberately annoying Frankenstein’s monster of dynamic frameworks, static initialisers, and protocol conformances by pulling together a bunch of demo apps from previous articles. I figured I’d get more interesting results by attempting to give indigestion to dyld.
OK. This is the bit you’ve been waiting for. Let’s take a look at how iOS 27 changes things.
iOS 26 vs iOS 27Because I’m very stupid, I only took 3 traces on iOS 26 (2 warm; 1 cold). Then, contritely, 2 warm and 2 cold for iOS 27. Look, I’m not a proper scientist, and you mostly read this for the feel-good vibes. Profile it yourself if you have to. Seriously, the codebase (and traces) are open-sourced here: Cold Launch (iOS 26)
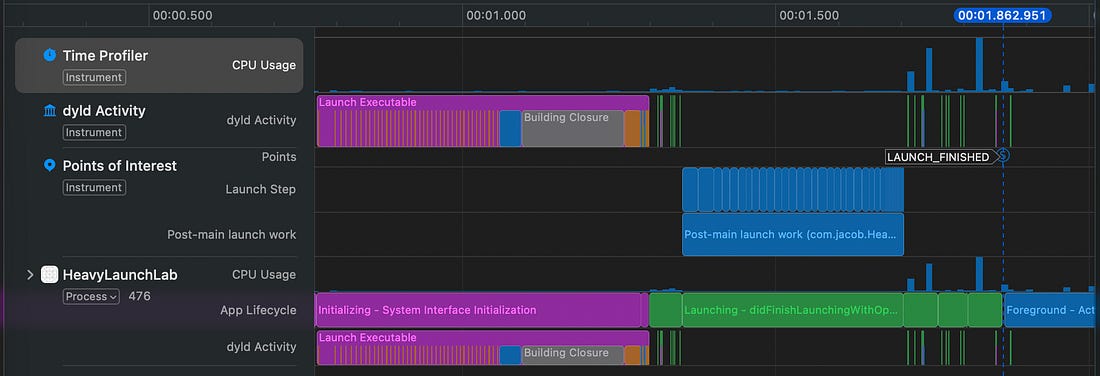
Warm launch (iOS 26)
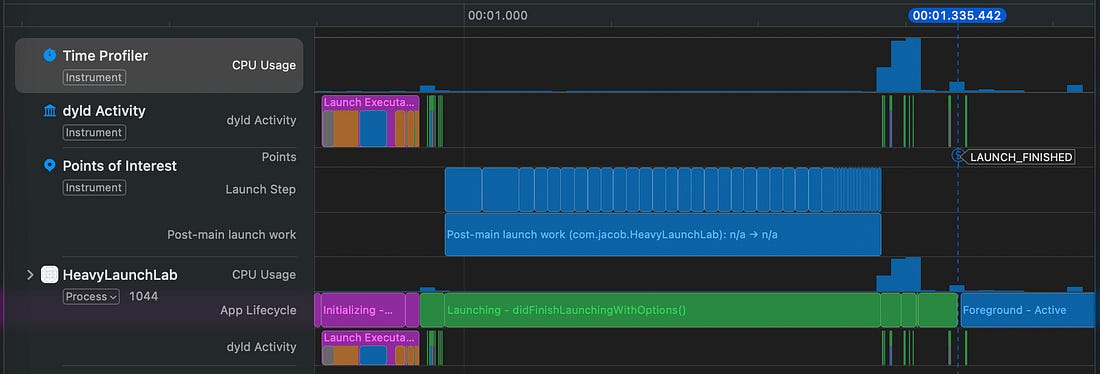
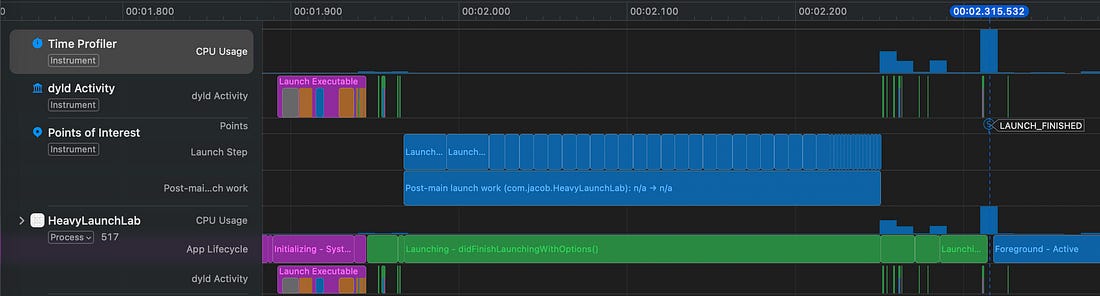
Immediately you can see the timescale of pre-main time is drastically squashed. Almost 4x faster, with the closure and memory mapping steps drastically quicker. The blue fixups step seems about the same, which checks out because ASLR is reapplied at launch. Ok. Let’s do this. *Irreversibly installs iOS 27*Cold launch (iOS 27)
Warm launch (iOS 27)
On our only mildly scientific test, we’ve successfully validated a (non-statistically-significant) speedup:
Most of the drop comes from the pre-main phase. Closure rebuilding was 1.5x faster, fixups were 2.5x faster, and static initialisers were 3x faster. The remainder mostly consists of I/O work, such as memory-mapping for all the dynamic binaries (orange), which seem about the same on both OS versions. The shape of the dyld phase remains the same across each sequence. This isn’t the full rebuild of dyld cited in previous OS releases. But our data checks out: Apple claimed their 30% speedup came from 2 things:
Post-main had a bit of a boost to Initial Frame Rendering, where Core Animation commits the first frame of the UI. Most of the rest of my “launch steps” in the sample project are dumb sleep()s designed to simulate a poorly-thought-out launch sequence. Apple’s launch improvements, every yearApple has cited lots of improvements to their launch speeds in the last decade-odd.
Hmm… 2x… 2x… 2x… and 1.3x… this multiplies up to a potential 10.4x improvement to launch time for “some apps”. Wait a minute. Since 2016, we’ve jumped from A9 to A19 chips too. Another 10x increase. So, uh, why is app launch not ~100x faster than 2016? I reckon we need to do less sh*te at launch. Let’s switch off some of those marketing SDKs 👀 Last Orders 🍺Every couple of years, Apple likes to take their system guys out of hibernation to tweak the dynamic linker, CPU scheduling, or pre-warming in order to eke another 2x, or perhaps a diminishing 1.3x, or more likely my measured 1.2x, performance boost out of their launch times. This is nice. But the onus is still onto you to architect your app’s critical launch path to be responsive to your users.
That’s the iOS 27 launch for now. See you next year 👋
Sent from my iPhone
|