High Performance Swift Apps
From The Vault™ this week is one of my favourite ever posts. It was certainly the most fun I’ve had building and writing something. I’m gonna take you through my patented 3-step process to drastically improve the performance of your app. Along the way, we’ll find a few very interesting algorithm and concurrency puzzles along the way. I am finally releasing the source to turn this into a code-along tutorial! → Get the before sample code. → Get the after sample code.
This article is very long, so your email client will probably cut it off. Read on my website for the best experience. Two weeks ago, I released Check ‘em: The Based 2FA App. The concept was pure: a two-factor authentication app which sends you a notification whenever a really great number shows up. Tap the notification to permanently add it to your collection. The kind people of Reddit enjoyed my write-up — from idea, to proof-of-concept, to release — enough to propel me to #3 on r/programming.
Check ‘em calculates millions of 2FA codes into the future, processes each number to determine if it’s interesting, and schedules the interesting codes as push notifications — GETs.
My app performance evaluation process has three steps:
This find-problems-first approach avoids bike-shedding, keeping the focus on the real bottlenecks.
This approach helps me avoid wasting time on general code improvements that don’t move the needle for our users (so the singletons are here to stay — sorry not sorry). Testing On-Device
Processing speedThe big, glaring performance problem is exactly where you’d expect: processing your numbers while computing 2FA codes. This processing runs every time you enter the app, make a change to your 2FA accounts, or update your choice of GETs. TOTP calculation itself is a non-trivial function, involving byte manipulation, string creation, and cryptographic operations. These codes are then checked for several kinds of interestingness, before scheduling push notifications for the most interesting codes. This processing is pretty fast when a user has common GETs enabled, such as quads (e.g. If a user only wants to see rare GETs, such as quints (e.g. 
Rarity increases exponentially with each tier. With only ultra-rare GETs enabled, such as sexts (e.g. As expected, this is by far the biggest performance bottleneck. Time-to-first codeSince the app is pretty simple, just 1500 lines of Swift, the surface area of potential performance problems is pretty constrained. A less offensive issue rears its head each time you launch the app fresh — while the launch itself is lightning-fast, it takes a little while for the first 2FA codes to appear.
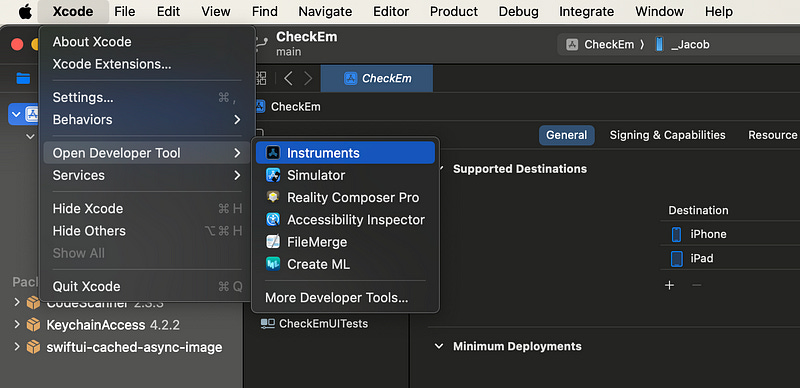
Since a user would, ideally, be using this app for 2FA codes in their day-to-day, having useful codes snap into existence instantly would improve the user experience for the functional use case of this app. Profiling with InstrumentsNow we’ve identified the two key user-facing performance issues, we can perform a detailed analysis with Xcode Instruments. This profiling will allow us to detect the exact function calls which bottleneck our code. Setting up InstrumentsIf you’re new to performance profiling, Instruments is a separate app which can be opened from the Xcode Developer Tools menu.
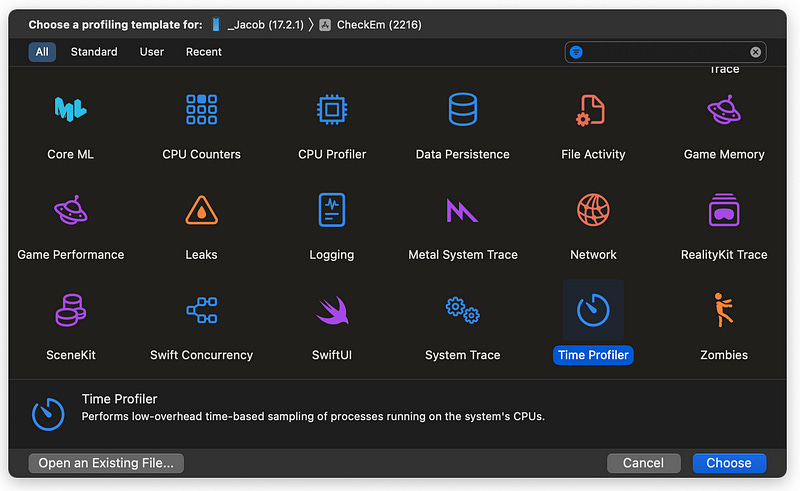
Our bread-and-butter Instrument is the Time Profiler, which monitors CPU cores. It samples these cores 1000 times per second, recording the stack traces of the executing functions. The resulting report shows which parts of your code are hogging compute resources.
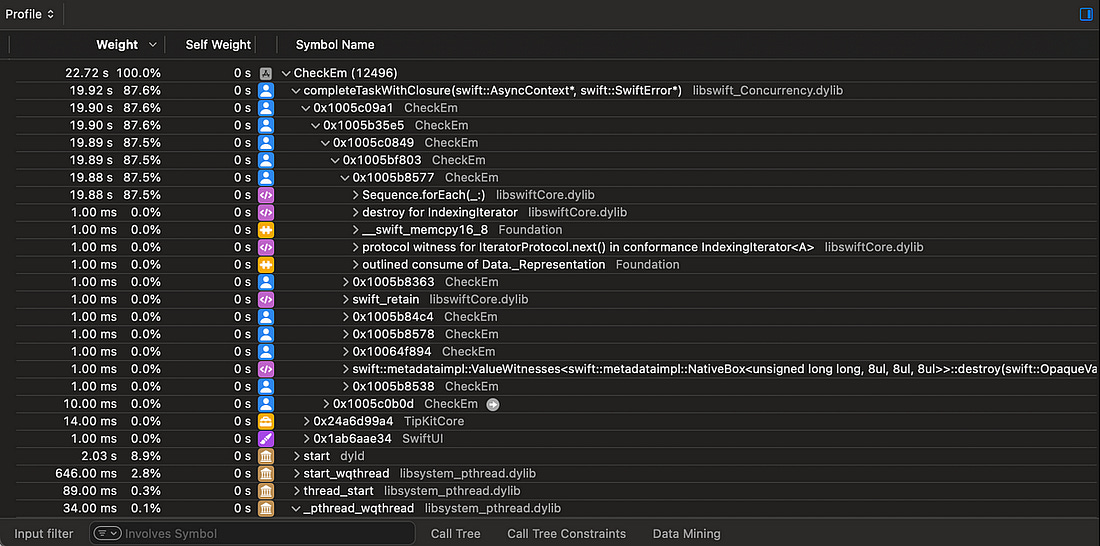
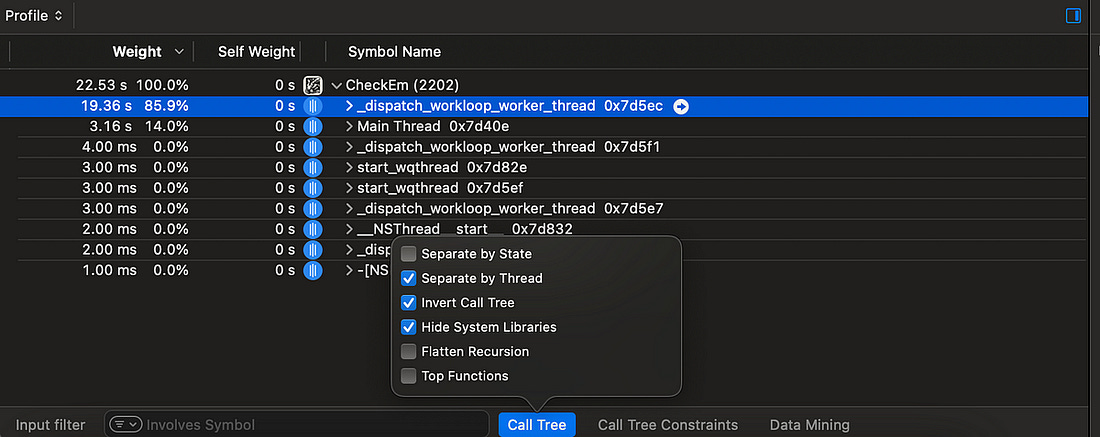
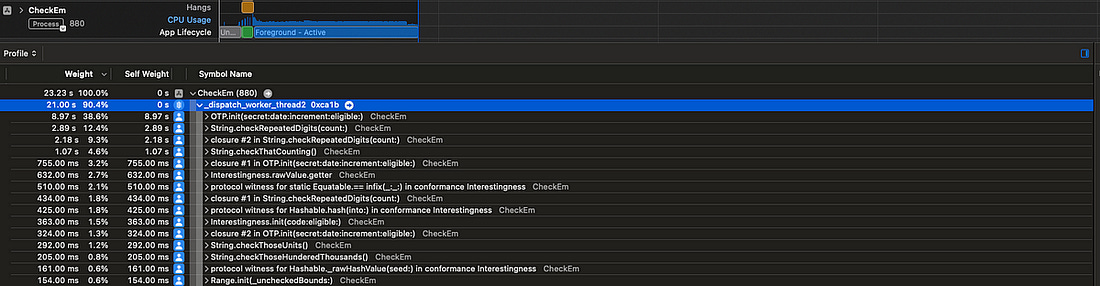
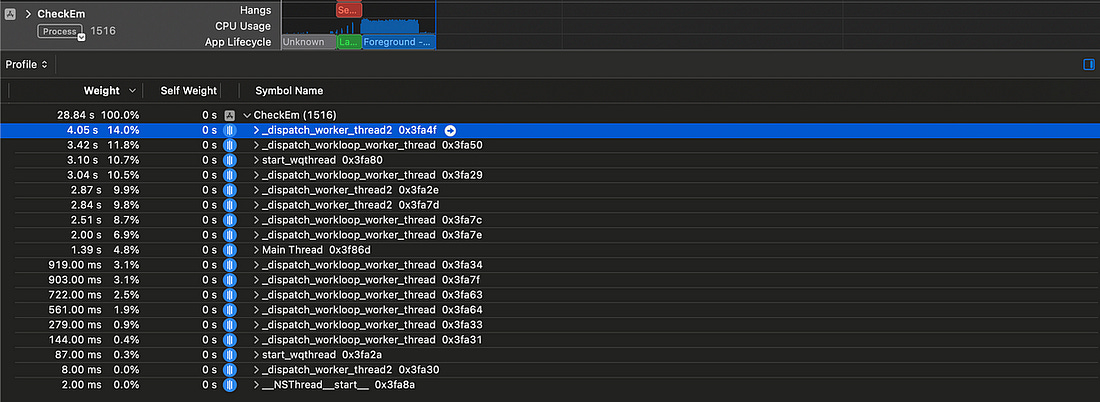
Now we’re all set up, we can start our investigation. Processing speedOpening up our app, and monitoring the notification re-computation, we see some kind of async process taking up nearly 20 seconds as Check ‘em searches for interesting codes.
To make this easier to comprehend, there are 3 settings we can toggle from the Call Tree menu:
Now, we can easily see all the processing work which is happening on a background thread as we expect.
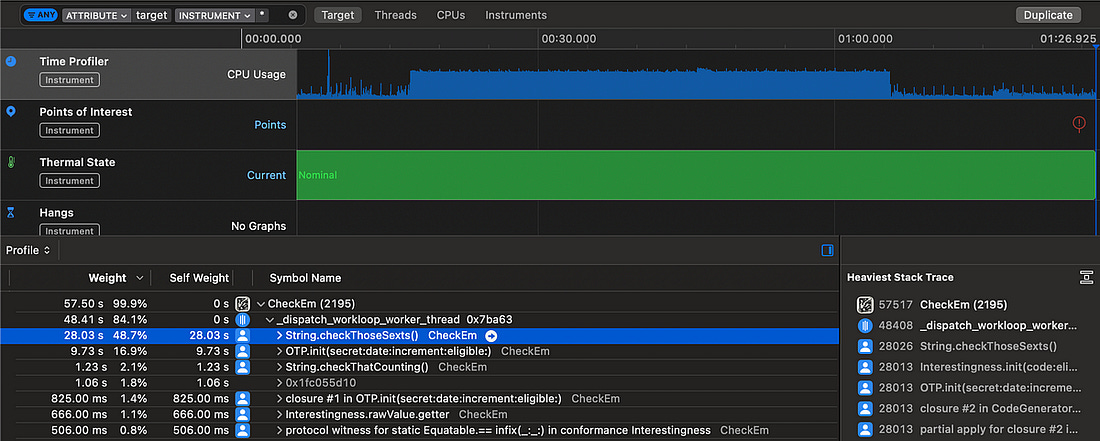
Our TOTP generation uses a non-trivial, but very well-specified algorithm. If I’d invented a way to speed this up, I’d be writing this article on from somewhere hot, on a yacht. What I’m trying to say is, we’re not likely to find a shiny new algorithm to speed up this TOTP generation process. Therefore, we firstly want to improve anything slower than the
We’ve found the smoking gun. The slowest calculation by far is When I also check for quints and quads, which use similar regexes, they also substantially outweigh the TOTP calculations.
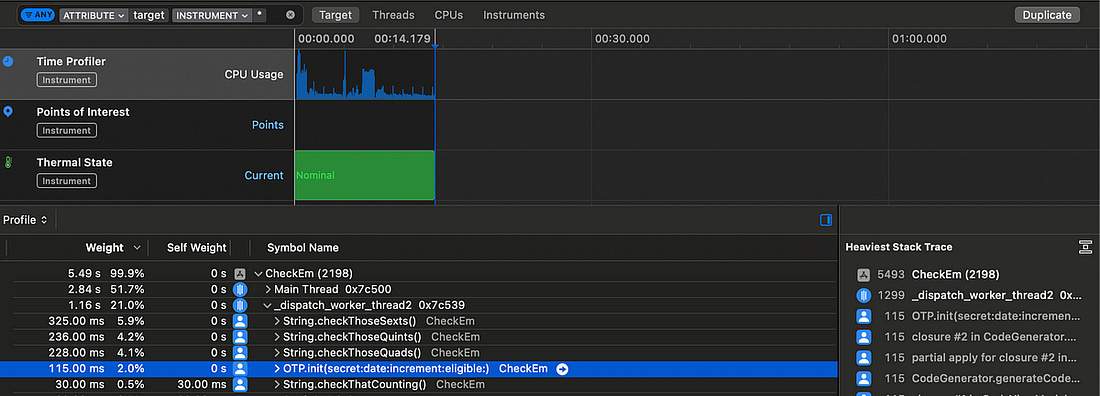
We’ve got a pretty clear indication that swapping out the regexes for alternative approaches could approximately double performance. This analysis helped me realise something further: this heavy processing is running serially on a single background thread, with pretty much all the heavy work offloaded to This means just a single CPU core is responsible for generating TOTPs and checking their interestingness. If we’re clever about it, this process is dying to be parallelised. Time to first codeThe other user-facing problem is the relatively slow time between opening the app and seeing a useful 2FA code displayed. Since we know exactly what start and end points in our code to look for — app launch up to the first displayed code — we can profile this problem with a blunter tool: The app currently takes a massive This shows two relatively long waits:
The keychain operation to fetch accounts, and the subsequent code generation step, are actually pretty quick, so don’t substantially impact the total time. Now that we’ve identified the key performance bottlenecks, we finally can start to make some targeted code improvements. Code ImprovementsOur basic run-through of Check ‘em found two performance issues:
Based on our detailed analysis, we identified 3 specific improvements we can make:
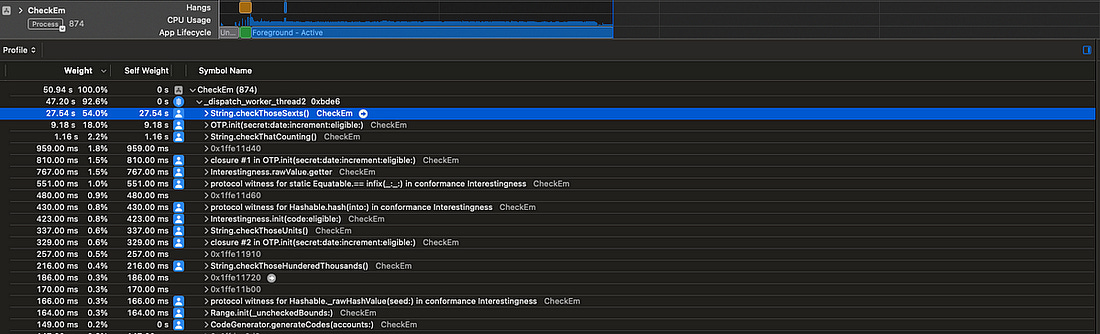
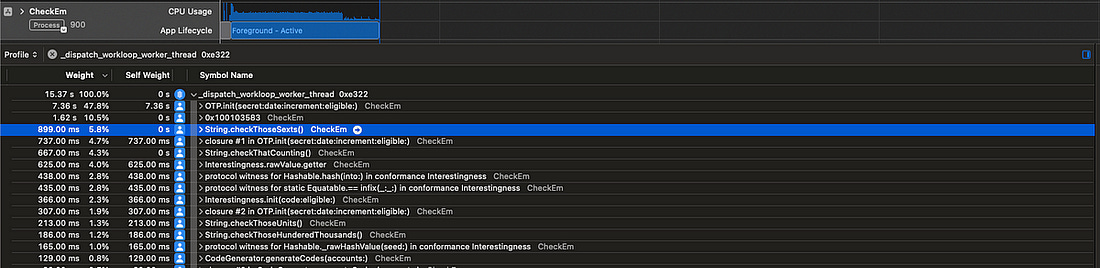
Let’s see how much speed we can squeeze out of this app! Efficient algorithmsThe slow regexes are the first big bottleneck we spotted using Instruments, taking up more than 50% of total processing time. Let’s benchmark our results using only ultra-rare GETs in the computation. Because these are so rare, the CPU needs to crunch 100x as many TOTPs to find these compared to common GETs, so finding 64 interesting GETs takes far longer.
We have our time to beat! That’s In one single function change, the sextuple check itself is more than 10x faster, slashing the total computation time down to Such is the power of focusing on bottlenecks.
I’ve written some neat code, but it’s actually pretty inefficient — we’re performing a heap allocation of 10 strings (from There’s an alternative, gruggier, approach, which might make life even easier — hardcoding a list of numbers. This avoids repeating the expensive string allocations. We can apply the same approach to the heavy operations that look for quads, quints, and counting. We’ve handily eliminated the biggest bottleneck: The
checkThoseSexts()
Now, this gives me a bright idea. There are only 1 million possible 6-digit TOTPs. Perhaps, as an upper bound, 1 in 100 are interesting*.
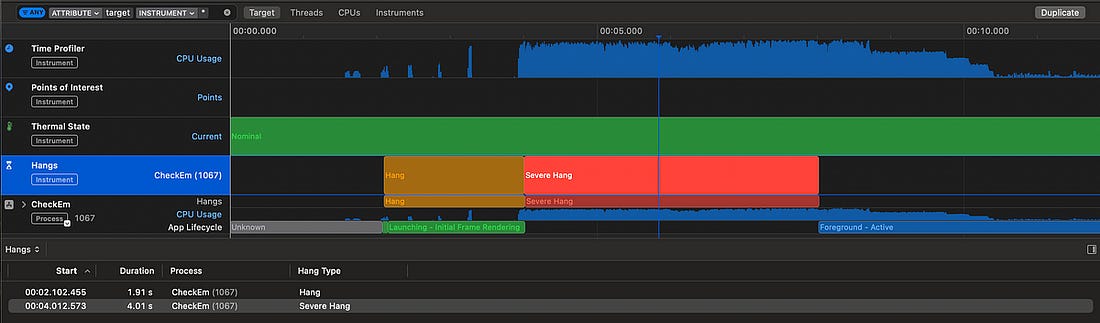
Ten thousand numbers isn’t that big. It wouldn’t take very much processing power to hold them in an efficient data structure such as a dictionary, keep this in memory, and look up interestingness with a single Additionally, this offloads the computation from users to my trusty M1 MacBook, and saves the environment. But, while this is a bright idea, this isn’t the bottleneck! Therefore, I’m going to regretfully leave it for now. TOTP calculation now takes up the vast majority of processing time. This is an appropriate time to invoke our CPU cores. ParallelismAll our computation is currently performed on a single background thread. I’ve been wondering how I might improve this. The natural idea would be to ‘chunk up’ the TOTP calculation, and put each chunk on different threads. But how would we apply this chunking? We can’t necessarily do it by day, by week, or by month, since we might end up running lots of computation that we can’t use — we can only schedule a maximum of 64 notifications at once on iOS. Let’s find an approach which minimises complexity. Let’s use the CPU architecture as a guide: modern iPhone processors contain 6 cores, so let’s aim to use 6 simultaneous chunks. We can use We can then run these 6 parallel processes to calculate every 6th TOTP code into the future. Each process ends when it has found 1/6th of the total interesting numbers. This seemed to process faster, however it completely locked up our UI with hangs. The app was near-frozen and unresponsive while it processed our TOTP codes.
This is because I am forcing 6 high-priority processes to happen at once, so the main thread has to share rendering cycles with this expensive computation. This would be even worse on many older iPhones that don’t have a full 6 cores available — therefore, we should limit the number of processes to one per CPU core, and leave one core spare for the UI thread. Now we’re talking! This gives us a much healthier 5 threads of heavy, chunked-up computation and one very calm UI thread, without any hangs to write home about.
This parallelism has taken our longest-running thread from a heavy We are using 5 cores. Why isn’t this neatly 5 times faster? Maths and ActorsThere is still an issue with our approach: each of our The fastest thread might find This problem is twofold:
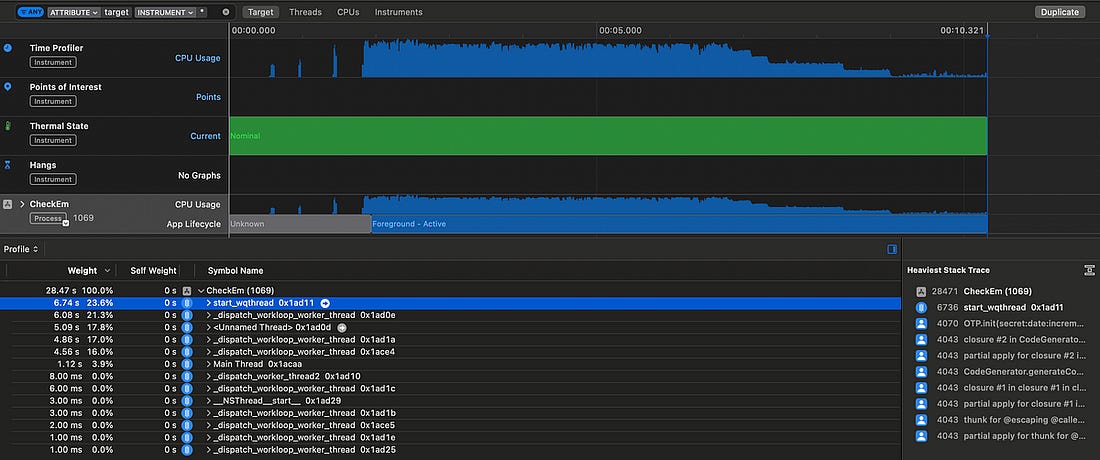
Perhaps, instead of working from an offset, each thread simply runs independently and calculates the next un-calculated code. Therefore, we need a way to safely share state between these threads and ensure each new TOTPs calculated uses the next un-calculated 30-second date increment. Swift offers a neat solution to this problem with Actors, which enforce serial access to their state. Compared to our first attempt at parallelism, which allowed each thread to run wild calculating every 5th TOTP independently, this approach requires coordination between our processes. This coordination adds overhead — each process is a little slower individually because they might need to wait to call Consequently, each time Let’s measure how this performs!
This Actor-based approach leads to several more threads in-flight at once. Swift concurrency aims to have approximately one thread running per CPU core, in line with our original parallelism goal, and manages threading itself using a system-aware cooperative thread pool. The total cumulative execution time given in instruments is the sum across each thread. This is of course not representative of the time our users are waiting — to get a proper measure, let’s crack out our trusty timestamps again and measure the total speed for calculating interesingness for ultra-rare GETs. Original speed without parallelism
Speed using chunking and (n-1) threads
Speed using Actor coordination
This shows us that the additional thread coordination overhead we take on with actors is worth it — the process is more correct, it more efficiently utilises our CPU cores, and is overall makes this computation step 47% faster! Earlier code generationOur final piece of performance profiling, using We are first waiting for This is a pretty simple fix: decouple This drastically cuts down the time between app launch and code generation — from Now, the codes snap into the screen almost immediately.
ConclusionCheck ‘em — The Based 2FA App was a madcap idea I turned into a side project, and had an enormous amount of fun with. What I didn’t expect was to encounter an extremely interesting performance optimisation puzzle as the centrepiece of my second ( Now, the app is firing on all cylinders:
Sent from my iPhone
|